整理ChIP-seq / CUT & Tag 分析时用到的工具。本文只对使用的工具用法进行简单介绍。
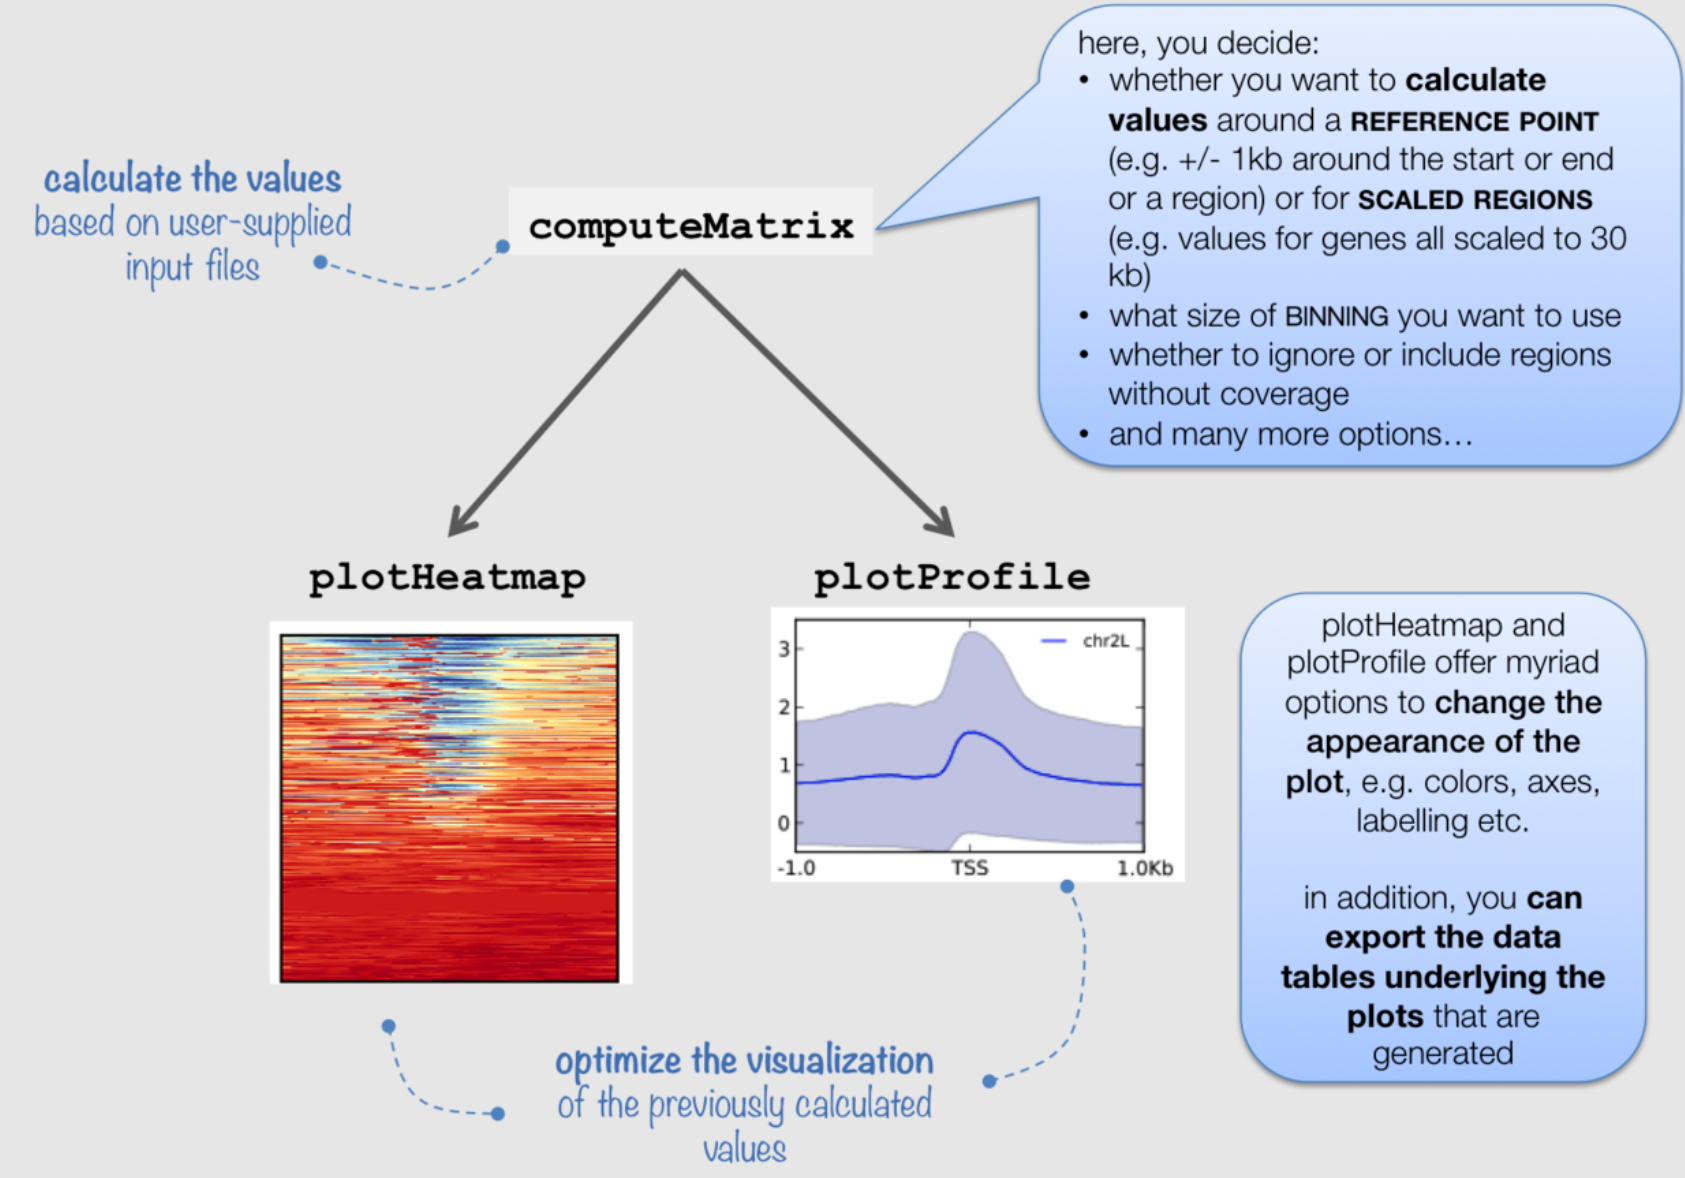
deeptools 提供了computeMatrix命令以计算特定基因组区域的ChIP-seq信号,并通过plotHeatmap和plotProfile函数分别产生ChIP-seq信号热图与谱图。
用法
computeMatrix
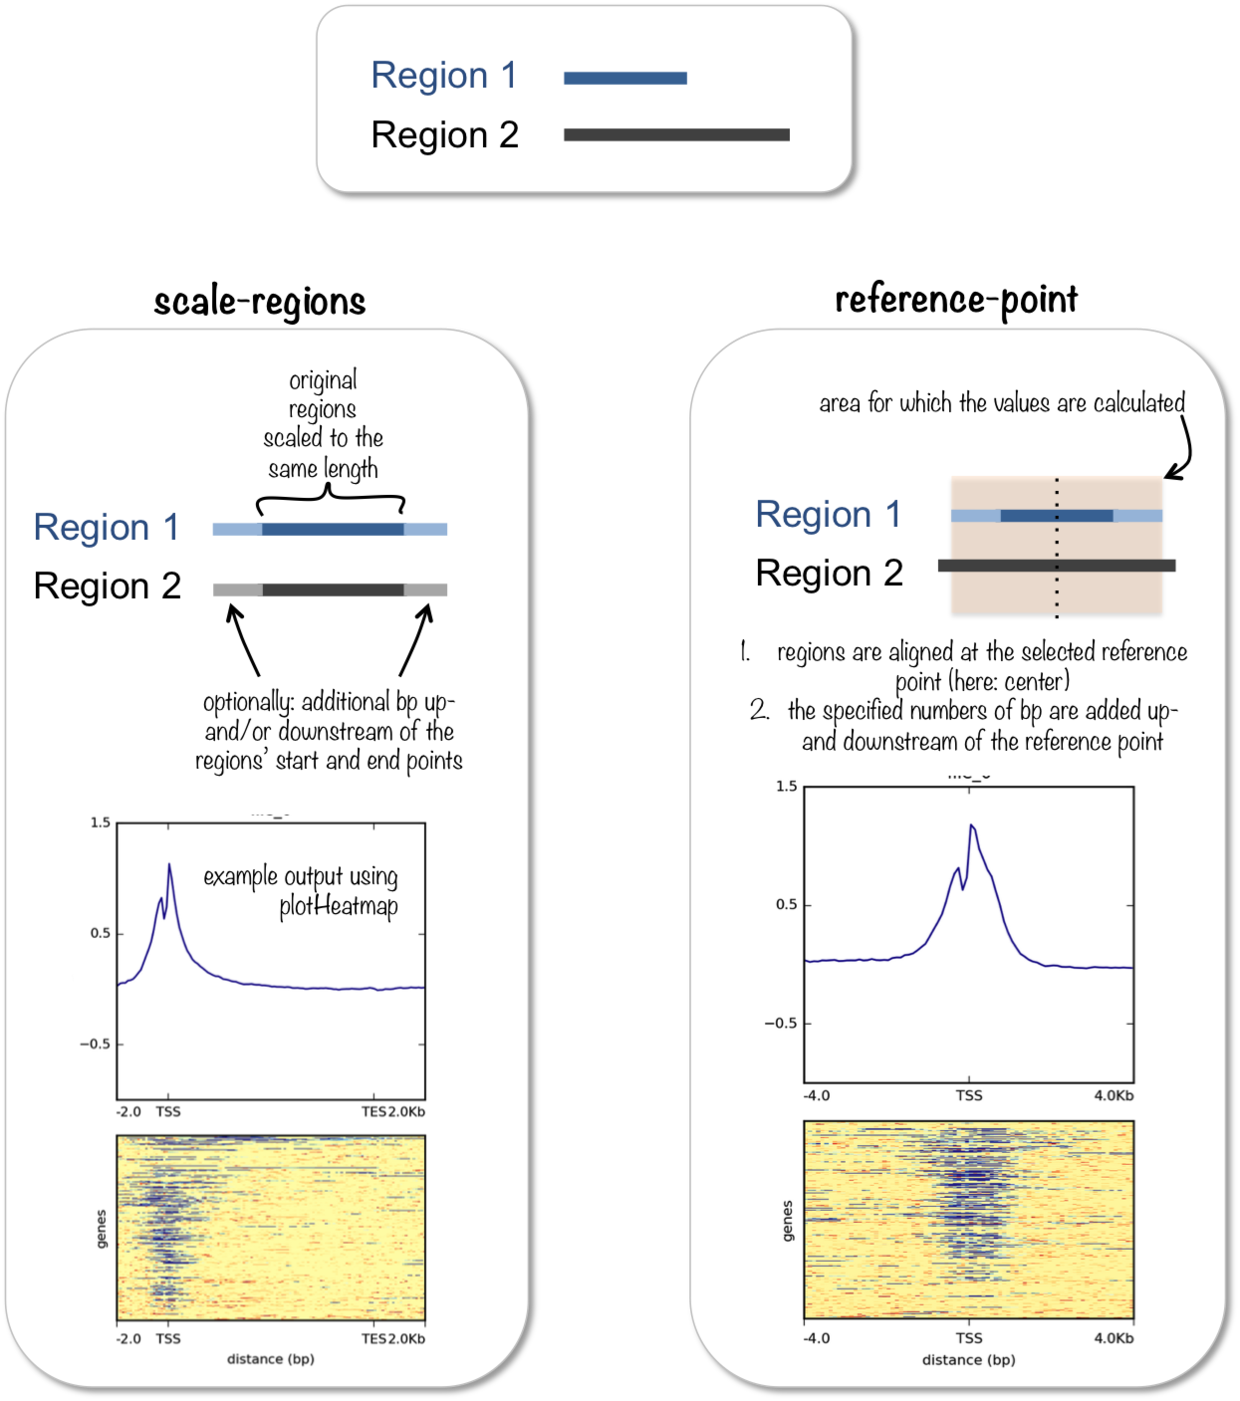
computeMatrix提供以下两种用法以不同的参考系计算ChIP-seq的信号
computeMatrix scale-regions:以一段区域为参考系,将所有参考的基因组区域缩放至指定的区域长度,计算该区域内的ChIP-seq信号computeMatrix reference-point:以某一坐标为参考系,取上下游一定长度作为窗口计算区域内的ChIP-seq信号值
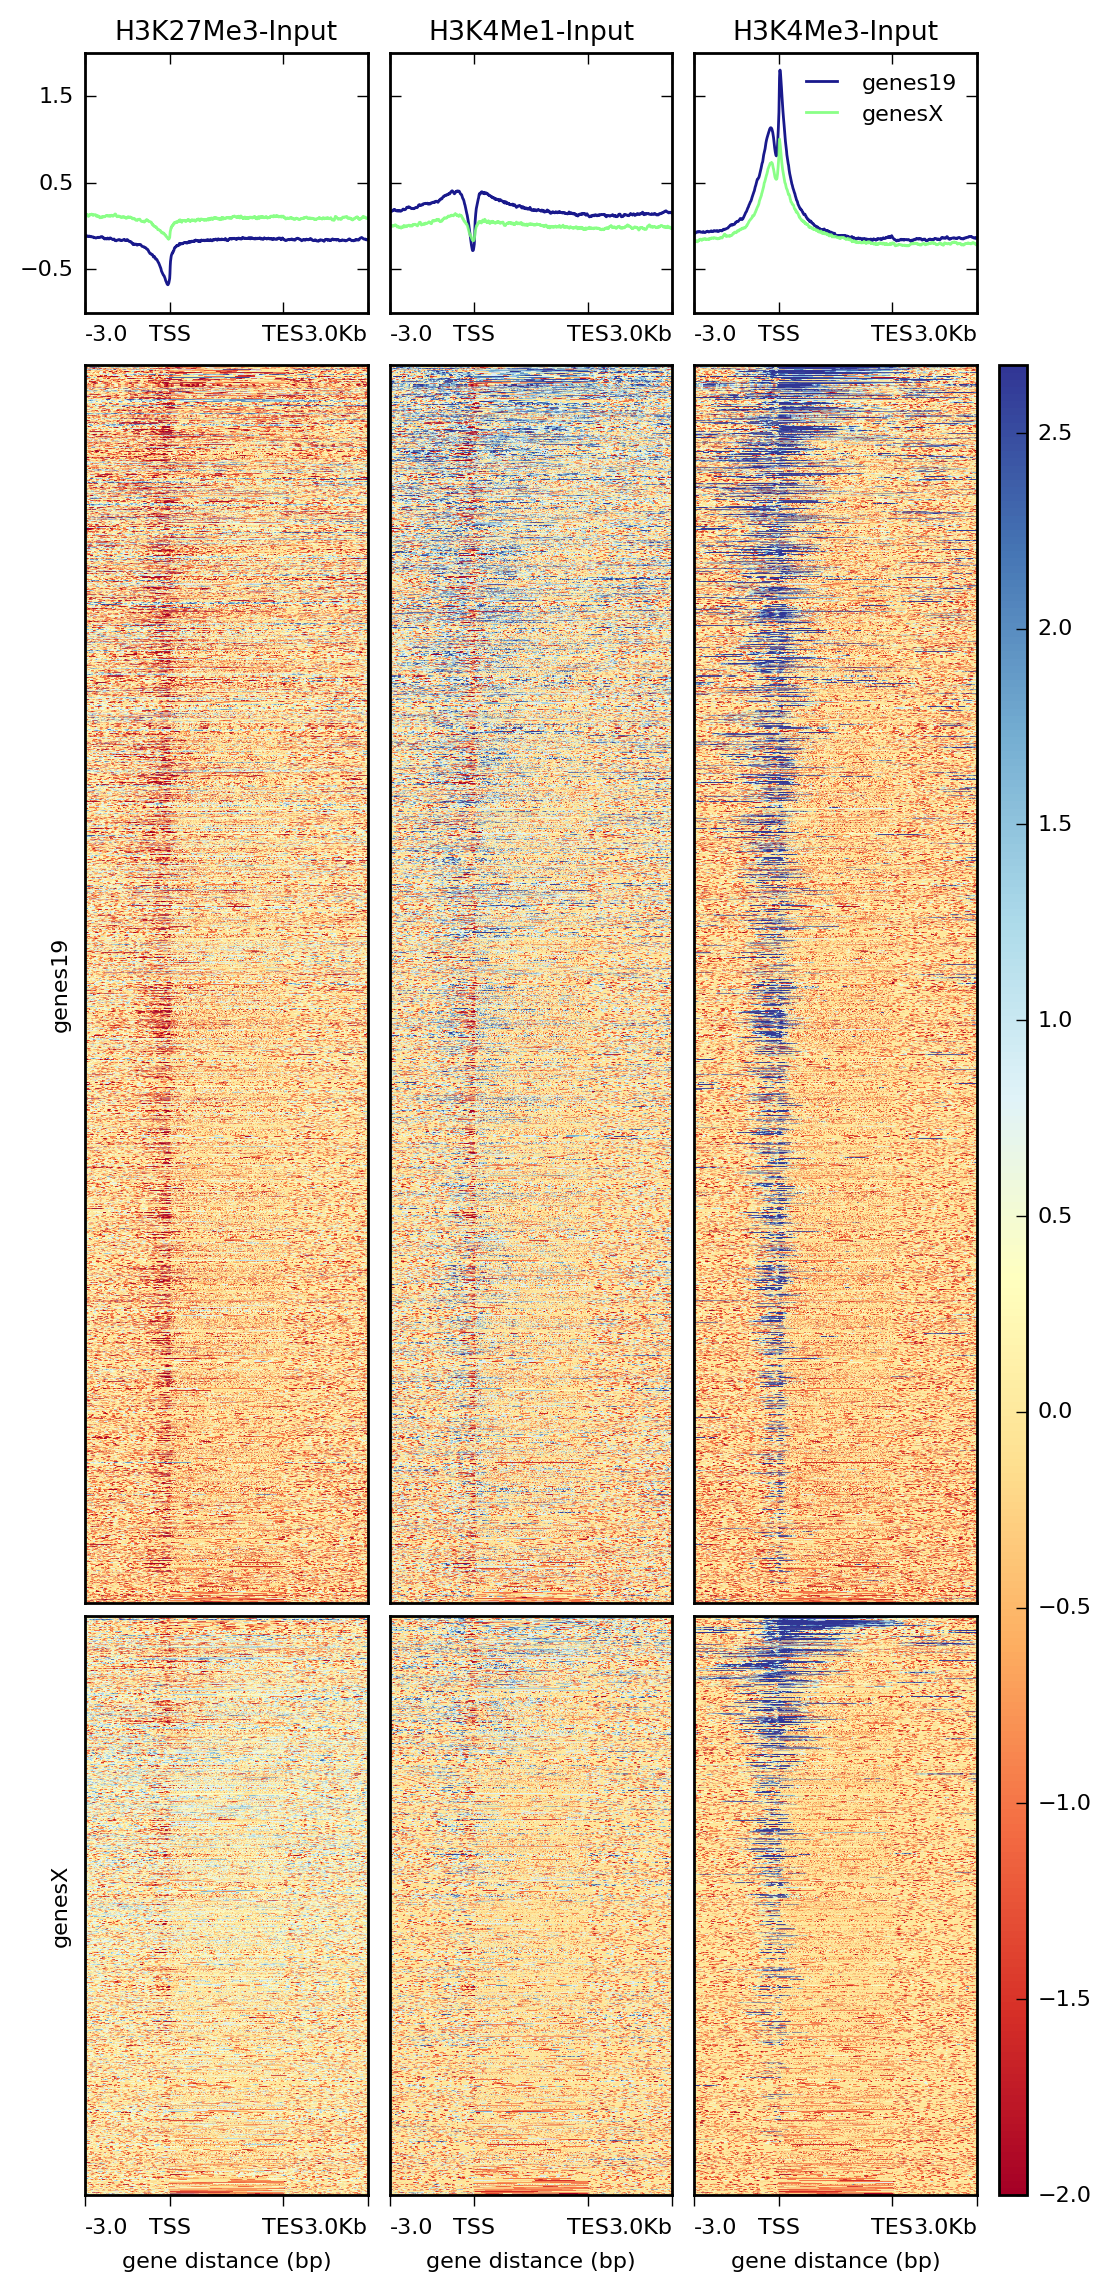
示例与参数介绍(结合plotHeatmap与plotProfile)
scale-regions
1 | $ computeMatrix scale-regions -S H3K27Me3-input.bigWig \ |
--scoreFileName, -S:输入的bw文件,可以是校正后的bw文件--regionsFileName, -R:BED/GTF 格式的文件,指定需要计算的基因组区域--outFileName, -out, -o:输出的文件--regionBodyLength, -m:缩放后的基因组区域长度(bp),指定的基因组区域都会被缩放至该长度--beforeRegionStartLength, -b, --upstream:基因组区域起始位点上游需要延伸的长度(bp)--afterRegionStartLength, -a, --downstream:基因组区域终止位点下游需要延伸的长度(bp)--skipZeros:设置后跳过只有0的位点。
1 | $ plotHeatmap -m matrix.mat.gz \ |
--matrixFile, -m:computeMatrix输出的结果文件--outFileName, -out, -o:输出的图片名称,格式可选 “png”, “eps”, “pdf”, “svg”等--whatToShow:输出图片中的内容,可选: “plot and heatmap”, “heatmap only”, “heatmap and colorbar”
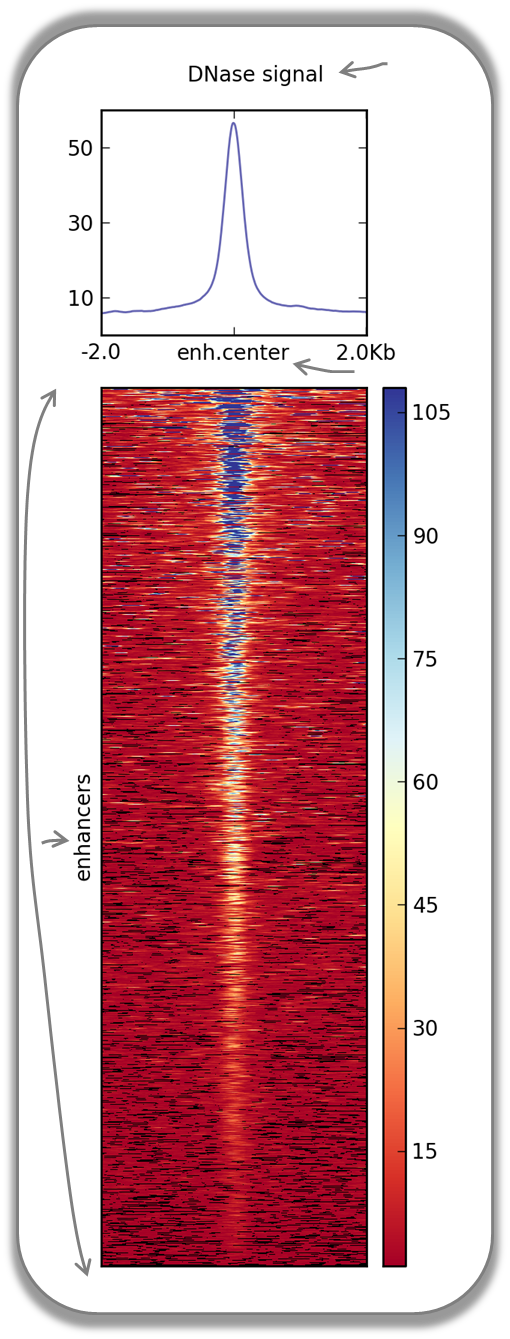
reference-point
1 | $ computeMatrix reference-point \ |
该模式大部分参数与scale-regions模式一致,不同的是:--referencePoint:指定参考点,可选:TSS, TES, center
1 | $ plotHeatmap \ |
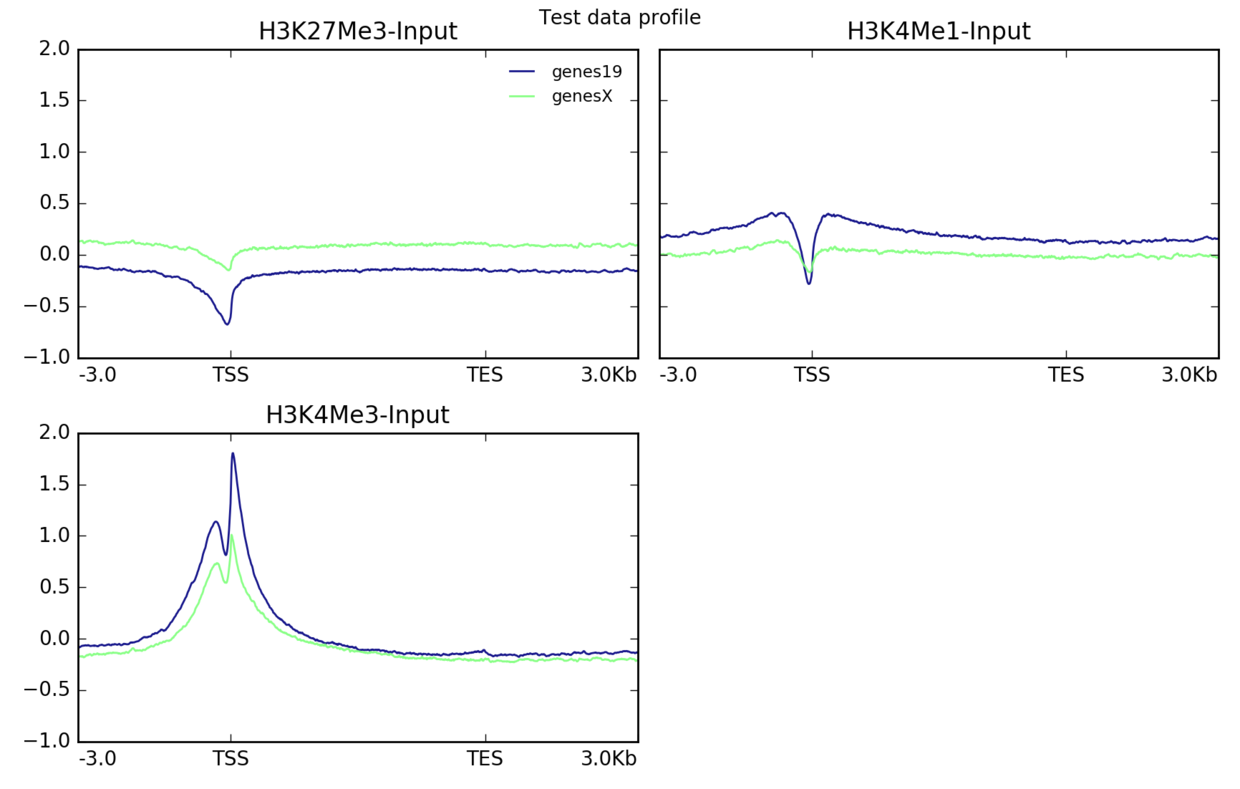
如果只想单独生成ChIP-seq信号谱图可以使用plotProfile命令
1 | $ computeMatrix scale-regions -S H3K27Me3-input.bigWig \ |
plotProfile的基本使用参数与plotHeatmap一致,这里就不再过多介绍。
以上就是使用deeptools生成ChIP-seq信号热图和谱图的简单例子,deeptools官方文档及其Gallery还有许多高级的用法与例子,有兴趣的同学可以深入学习。
ref
computeMatrix: https://deeptools.readthedocs.io/en/develop/content/tools/computeMatrix.html#deepBlue%20arguments
plotHeatmap: https://deeptools.readthedocs.io/en/develop/content/tools/plotHeatmap.html?highlight=plotheatmap
plotProfile: https://deeptools.readthedocs.io/en/develop/content/tools/plotProfile.html?highlight=plotheatmap
deeptools gallery: https://deeptools.readthedocs.io/en/latest/content/example_gallery.html#normalized-chip-seq-signals-and-peak-regions
完。