问题描述
近期在使用clusterProfiler的GO/KEGG富集结果进行绘图时,注意到一些条目的描述过于长,需要增加图片的宽度才能看到中间bar/dot的信息。
利用DOSE包中的数据进行如下展示
1 | library(clusterProfiler) |
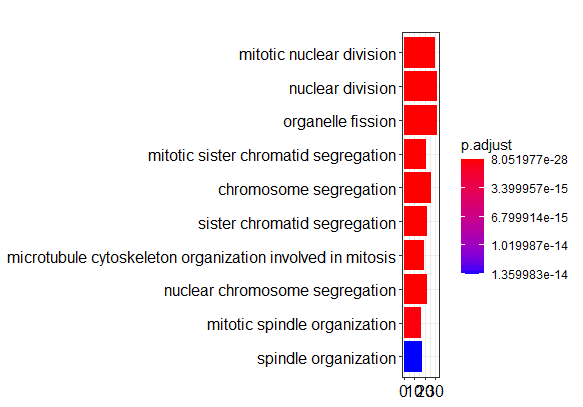
左侧注释信息太长导致中间bar的部分被压缩得难以比较,zoom虽然可以解决这个问题,但我还是希望有一个方法可以调整左侧字符,使得中间bar的部分在整张图内的占比更为合理。
解决方案
因此,在网上搜索到的解决字符太长的方法如下:
1 | barplot(yy, showCategory = 10) + scale_y_discrete(labels = function(x) str_wrap(x, width = 35)) |
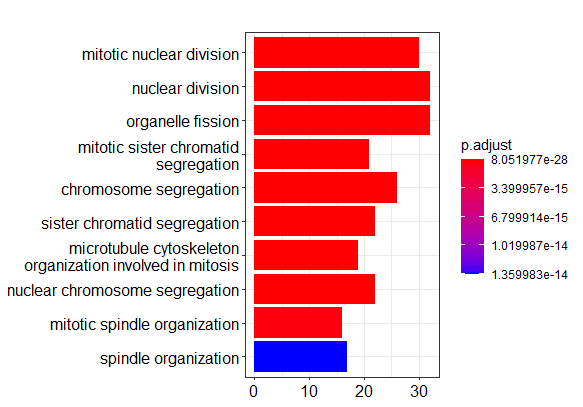
可以使用str_wrap()函数调整每行字符的长度。
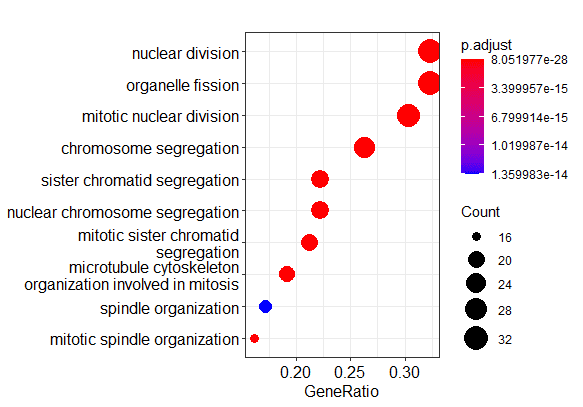
同样,dotplot也可以作如上的调整
1 | dotplot(yy, showCategory = 10) + scale_y_discrete(labels = function(x) str_wrap(x, width = 35)) |
可能以后会有一个专栏收集和记录一些日常使用R时的问题和解决方案
完。