“The greatest value of a picture is when it forces us to notice what we never expected to see.” - John Tukey
从油画当中汲取了一些配色方案,写成了一个R包 paintingr (https://github.com/thereallda/paintingr)
欢迎使用R画图的朋友给点意见和建议!
paintingr
paintingr 提供了一系列油画来源的调色板
paintingr 的代码结构参考了wesanderson 包
安装
目前可以通过github安装开发版本:
1 | # install.packages("devtools") |
后续会考虑发布到 CRAN 上
使用
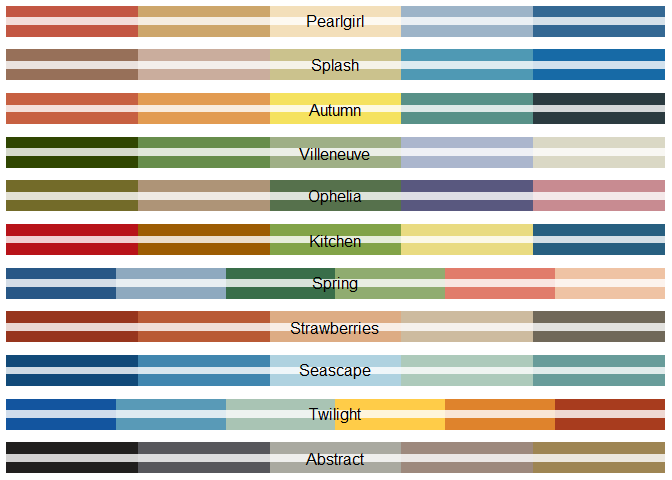
可以通过 display_all_palettes() 查看当前提供的调色板
1 | library(paintingr) |
使用 paint_palette("name") 获取某个调色板的颜色
paintingr 提供以下调色板
调色板
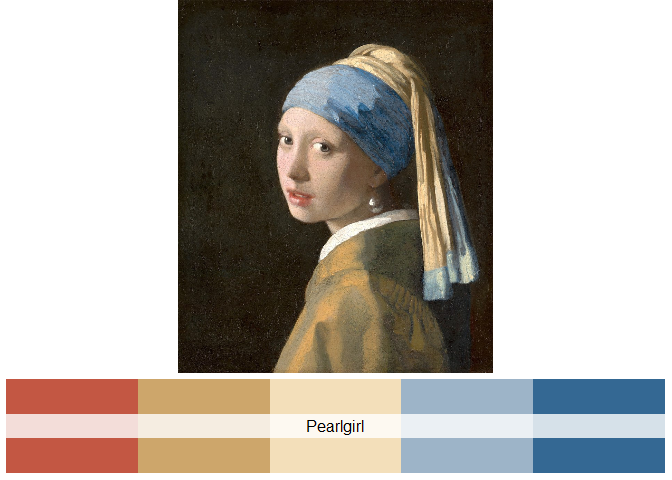
Pearlgirl
Girl with a Pearl Earring - Johannes Vermeer (1665), Source
1 | paint_palette("Pearlgirl") |
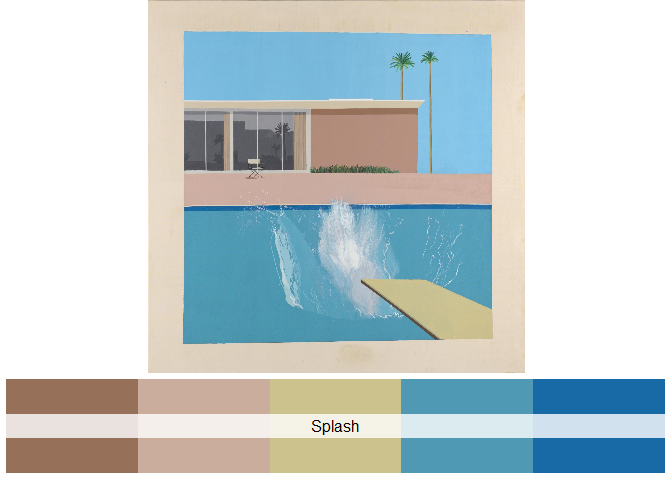
Splash
A Bigger Splash - David Hockney (1967), Source
1 | paint_palette("Splash") |
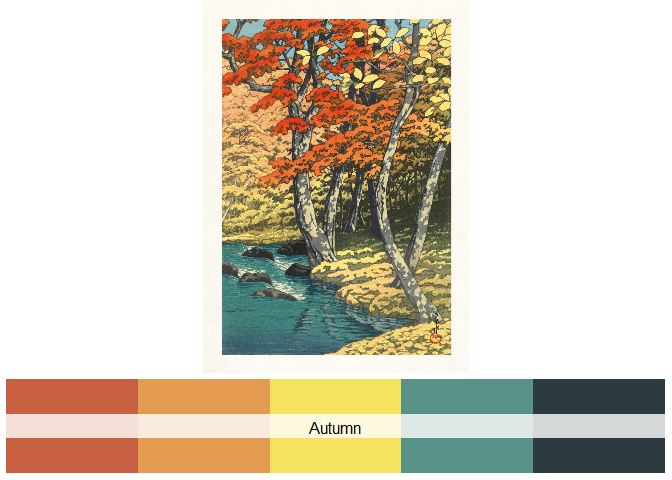
Autumn
Autumn at Oirase - Kawase Hasui (1933), Source
1 | paint_palette("Autumn") |
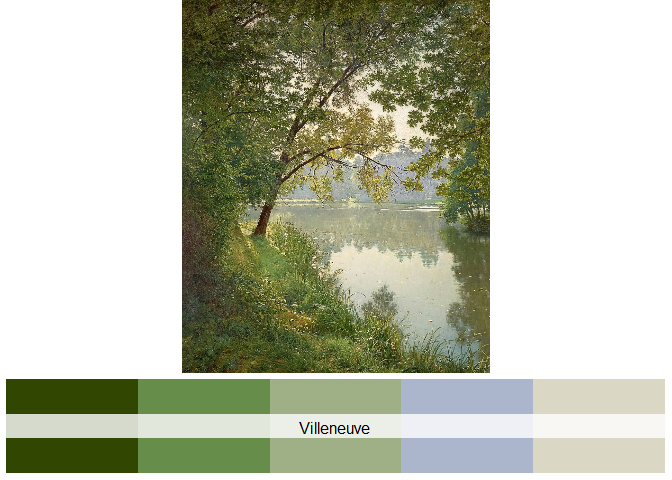
Villeneuve
Matin à Villeneuve - Henri Biva (1905), Source
1 | paint_palette("Villeneuve") |
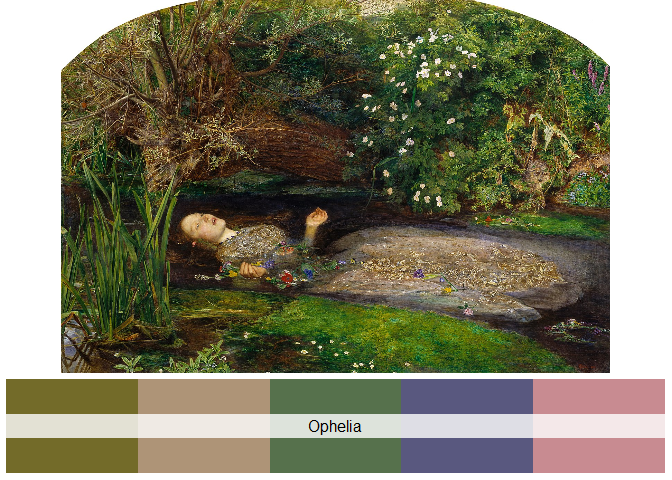
Ophelia
Ophelia - John Everett Millais (1851-1852), Source
1 | paint_palette("Ophelia") |
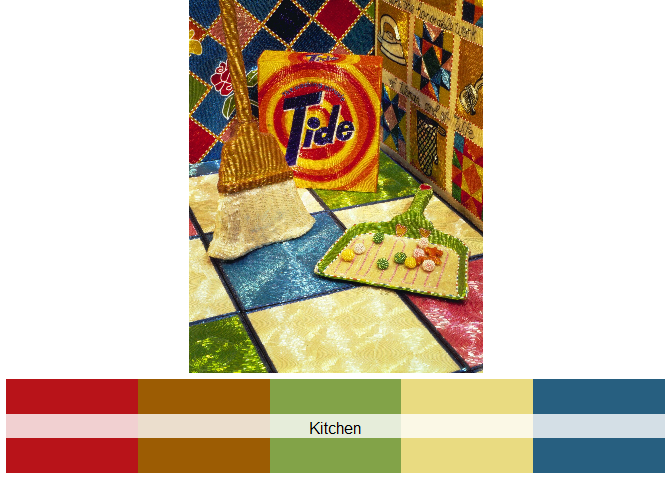
Kitchen
Kitchen (Detail 2) - Liza Lou (1991–1996), Source
1 | paint_palette("Kitchen") |
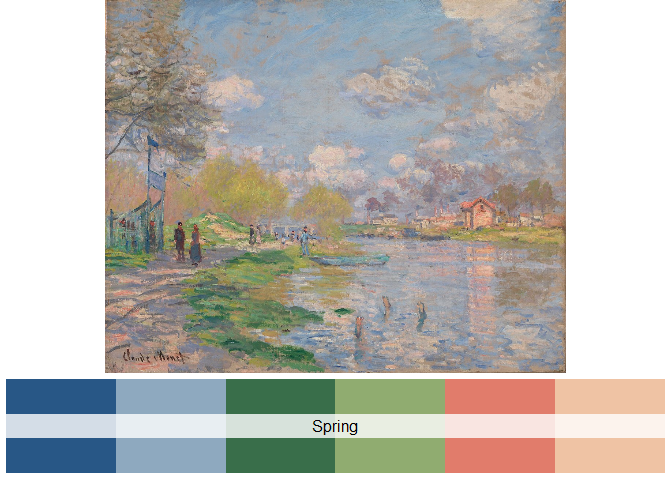
Spring
SPRING BY THE SEINE - Claude Monet (1875), Source
1 | paint_palette("Spring") |
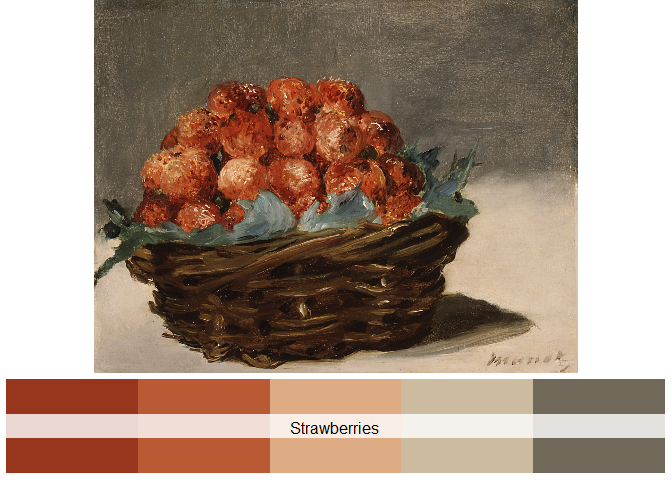
Strawberries
Strawberries - Édouard Manet (1882), Source
1 | paint_palette("Strawberries") |
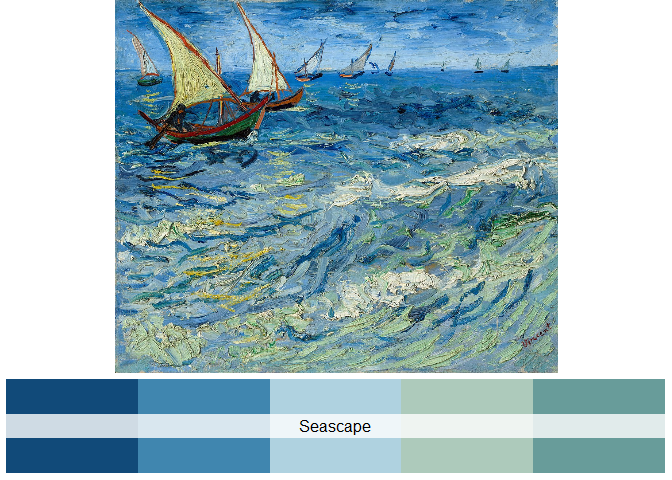
Seascape
Seascape at Saintes-Maries - Vincent van Gogh (1888), Source
1 | paint_palette("Seascape") |
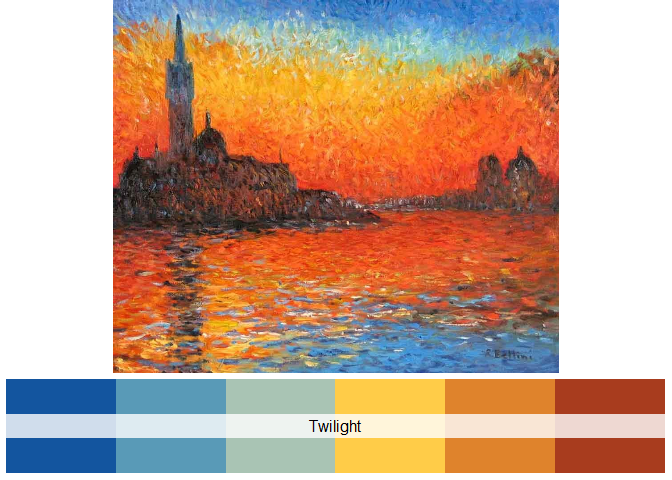
Twilight
Twilight, Venice - Claude Monet (1908), Source
1 | paint_palette("Twilight") |
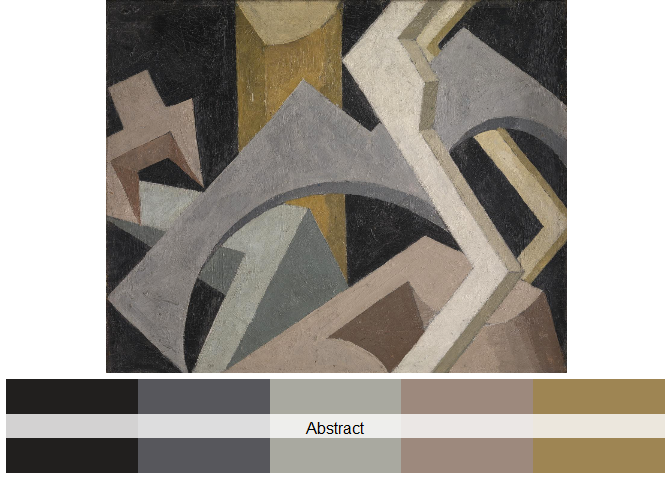
Abstract
Abstract Composition - Jessica Dismorr (1915), Source
1 | paint_palette("Abstract") |
一些例子
ggplot2-based examples
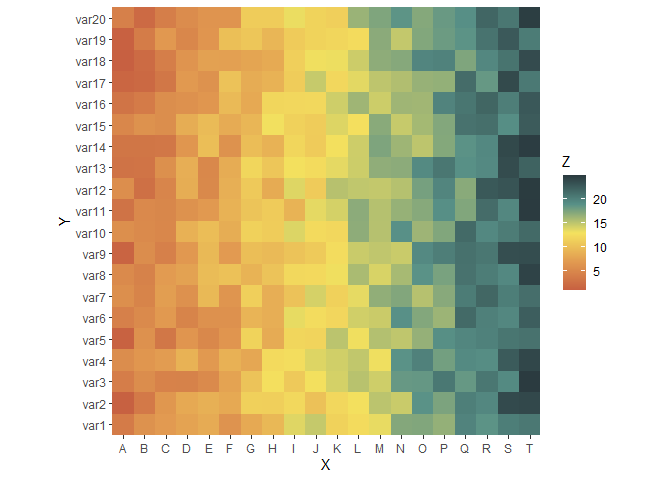
Heatmap
如果你需要更多的颜色(n > 5/6)时,可以使用 type="continuous" 参数,并指定需要的颜色个数
1 | library(ggplot2) |
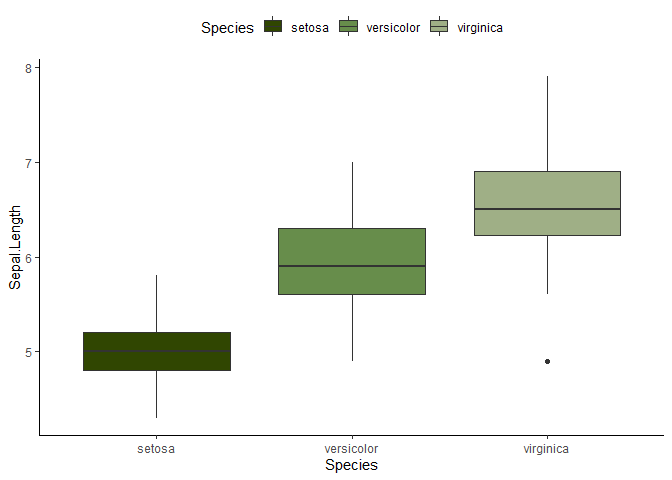
Boxplot
1 | # use iris data from `ggplot2` for demonstration |
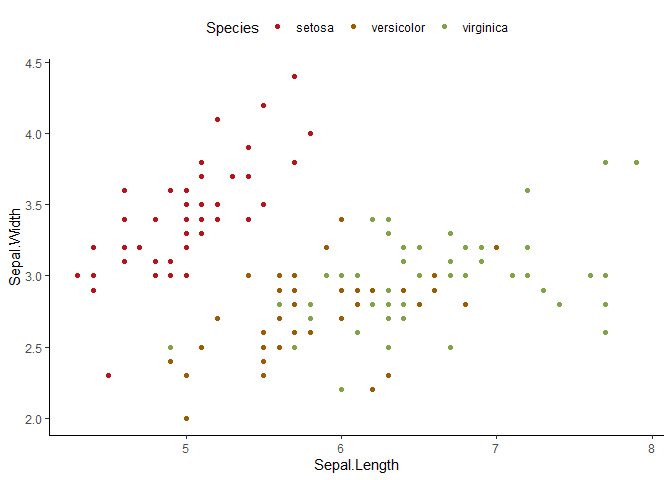
Scatter
1 | # Scatter |
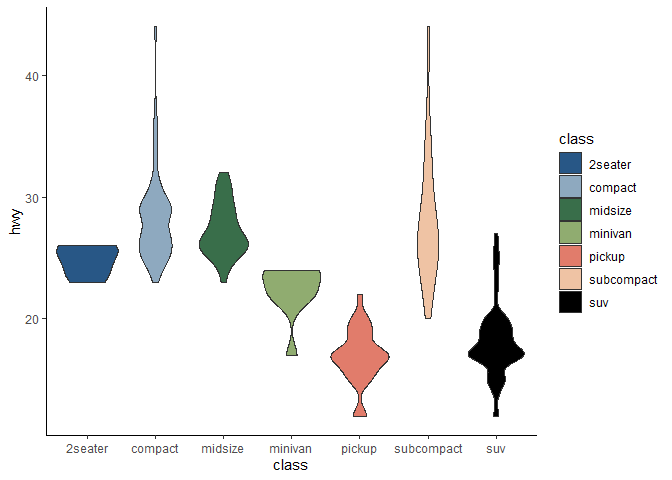
Violin plot
1 | data(mpg) |
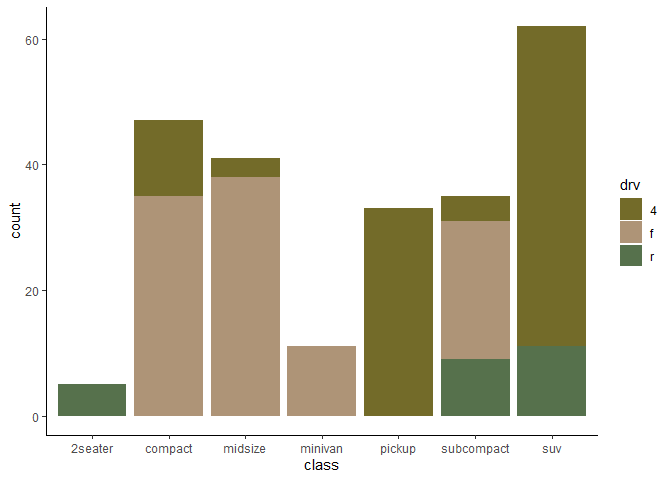
Barplot
1 | ggplot(mpg, aes(x = class, fill = drv)) + |