Signac是一个可以处理scATAC-seq、scCUT&Tag和scNTT-seq等检测单细胞水平染色质状态的R包,其主要步骤包括:
Create object
QC
Normalization
Dimension Reduction and Clustering
Inference of gene activity
Identify differential peaks
Plotting genomic regions
本文只讨论代码实现,具体原理可以参考Stuart et al. 2021 (Single-cell chromatin state analysis with Signac)
Data Download
The inputs files of signac can be generated from cellranger
本文用到的文件包括
Raw data: Peak-by-Cell matrix. 行为基因组区域(peaks),列为细胞barcode,其中的值为比对到该peaks上的read counts(详见https://support.10xgenomics.com/single-cell-atac/software/pipelines/latest/output/matrices)
Metadata
Fragments file: 在所有细胞中检测到的不重复的测序片段数目(详见10x Genomics website)。
1
2
3
4
5# example lines of fragments file
#chr1 9994 10157 AAAGGTTAGTTGGGCC-1 1
#chr1 10000 10144 AGGTCTTAGCCAGGTC-1 1
#chr1 10001 10103 GTTCTCATCCGGTTGA-1 1
#chr1 10001 10208 GCTTAGTAGTTATCTC-1 1Fragments file index
1 | # raw data |
Installation
1 | if (!requireNamespace("Signac", quietly = TRUE)) install.packages("Signac") |
Pre-processing
1 | library(Signac) |
Create Seurat object using peak/cell matrix and metadata
1 | counts <- Read10X_h5(filename = "10k_pbmc_ATACv2_nextgem_Chromium_Controller_filtered_peak_bc_matrix.h5") |
如果没有h5文件,可以通过counts matrix (.mtx), cell barcodes (barcodes.tsv), peak file (.bed) 来创建对象
2
3
4
5
6
7
barcodes <- readLines("filtered_peak_bc_matrix/barcodes.tsv")
peaks <- read.table("filtered_peak_bc_matrix/peaks.bed", sep="\t")
peaknames <- paste(peaks$V1, peaks$V2, peaks$V3, sep="-")
colnames(counts) <- barcodes
rownames(counts) <- peaknames或者直接用fragments文件创建
2
3
4
5
6
7
8
9
10
11
12
13
14
15
16
17
# Define cells
# If you already have a list of cell barcodes to use you can skip this step
total_counts <- CountFragments(fragpath)
cutoff <- 1000 # Change this number depending on your dataset!
barcodes <- total_counts[total_counts$frequency_count > cutoff, ]$CB
# Create a fragment object
frags <- CreateFragmentObject(path = fragpath, cells = barcodes)
# First call peaks on the dataset
# If you already have a set of peaks you can skip this step
peaks <- CallPeaks(frags)
# Quantify fragments in each peak
counts <- FeatureMatrix(fragments = frags, features = peaks, cells = barcodes)
接下来,只保留比对到标准染色体(22+2)上的peaks
1 | seqlevels(granges(pbmc_atac)) |
Peak annotation
在该示例中,10x Genomics 使用的参考基因组文件为“GRCh38-2020-A”,其对应的注释为Ensembl v98
其他版本的对应关系可在该网站找到:https://www.ensembl.org/info/website/archives/assembly.html
接下来,使用AnnotationHub进行基因组区域注释
1 | library(AnnotationHub) |
Computing QC Metrics
scATAC-seq 一般用到的QC指标包括:
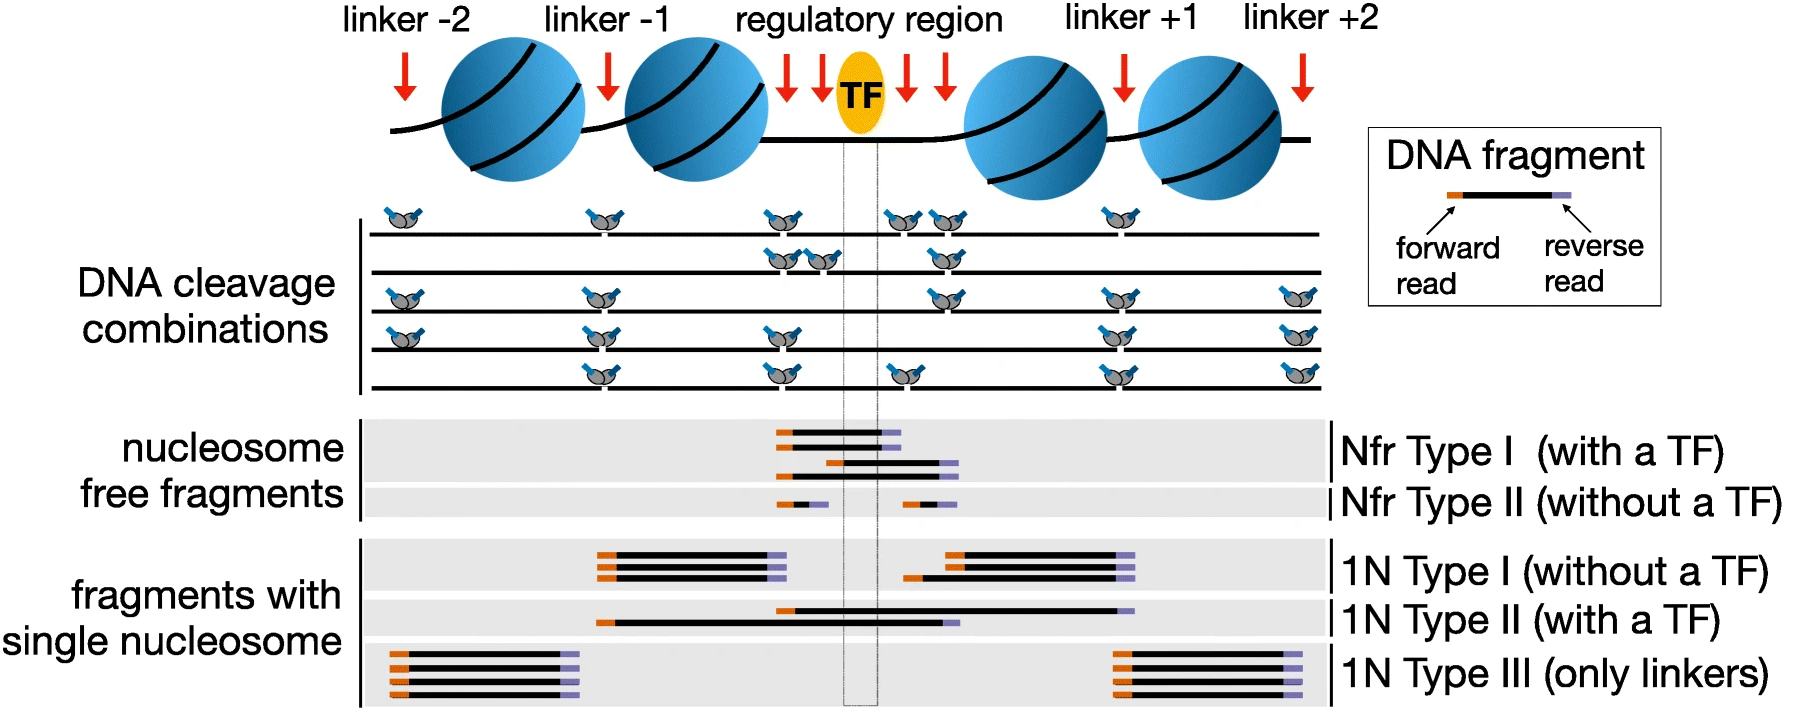
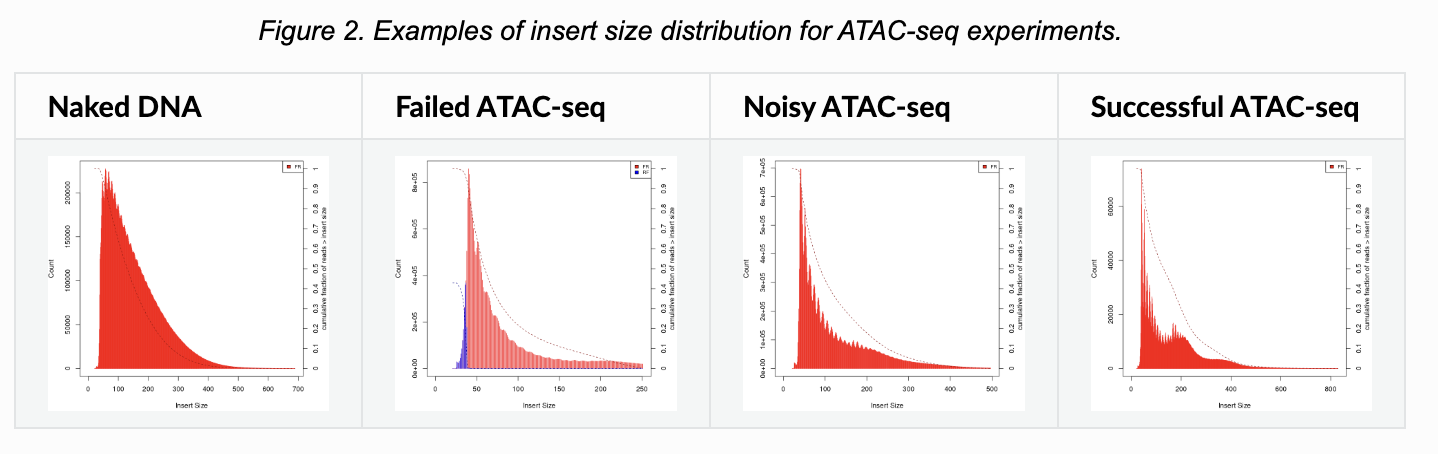
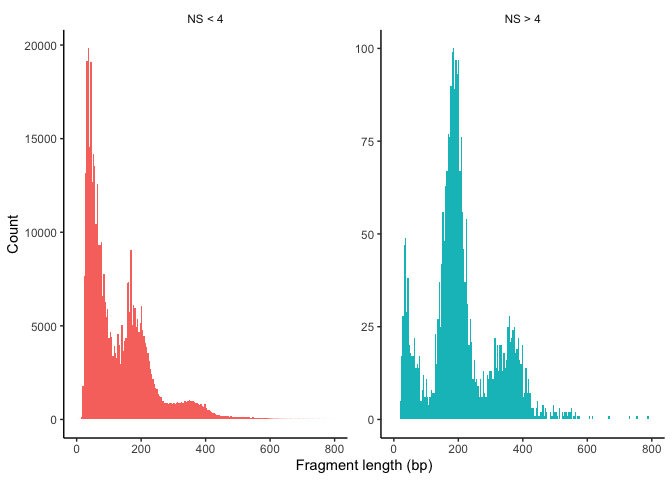
- Nucleosome banding pattern: 考虑到核小体由~147bp缠绕的组蛋白八聚体组成,质量较好的scATAC-seq数据的片段大小会展示出核小体的特征(~147bp).
Signaccomputes the ratio of fragments between 147 bp and 294 bp (mononucleosome) to fragments < 147 bp (nucleosome-free). Greater NS indicates poor quality.In ATAC-seq experiments, tagmentation of Tn5 transposases produces signature size pattern of fragments derived from nucleosome-free regions (NFR), mononucleosome, dinucleosome, trinucleosome and longer oligonucleosome from open chromatin regions (Figure below, adapted from Li et al ).
Transcriptional start site (TSS) enrichment score: 正在转录的基因的TSS区域常呈现开放的状态,质量较好的scATAC-seq数据的read counts也会在TSS呈现富集的特征
Total number of fragments in peaks
Fraction of fragments in peaks
Ratio reads in genomic blacklist region: ENCODE定义了一系列黑名单区域,比对到该区域的片段有可能是由于实验误差引起的. 这里Signac统计每个细胞中fragments比对到黑名单区域的比例。
blacklist regions provided by ENCODE (https://github.com/Boyle-Lab/Blacklist)
1 | # compute nucleosome signal score per cell |
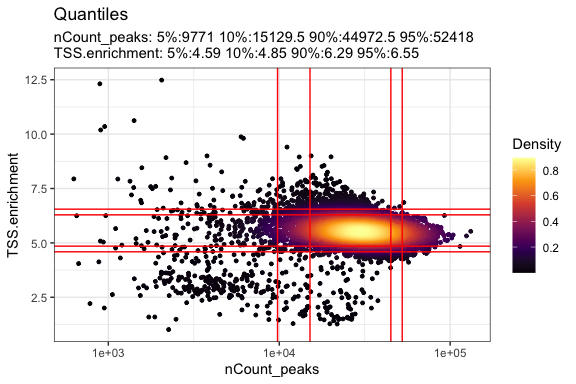
可视化QC指标
1 | DensityScatter(pbmc_atac, x = 'nCount_peaks', y = 'TSS.enrichment', log_x = TRUE, quantiles = TRUE) |
1 | summary(pbmc_atac$nucleosome_signal) |
1 | VlnPlot( |
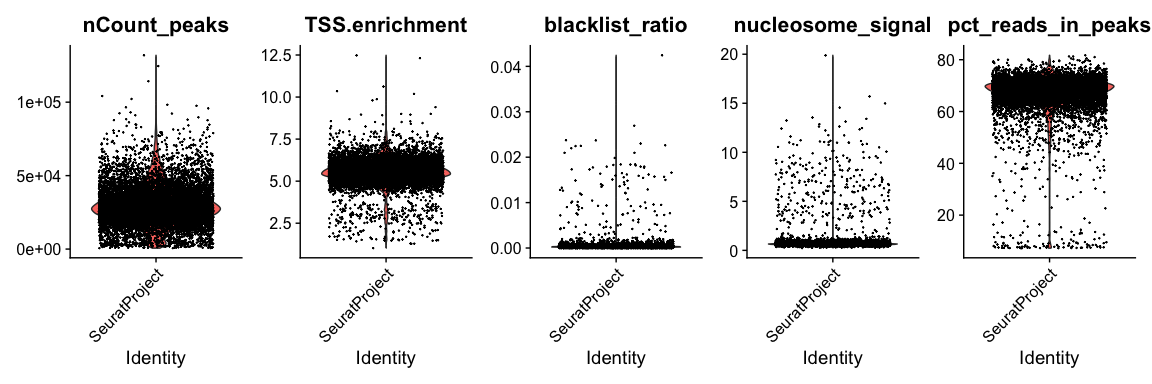
以下使用标准过滤pbmc的数据,实际cutoff需要根据数据调整
1 | pbmc_atac <- subset( |
Normalization and linear dimension reduction
- Normalization: Signac perform term frequency-inverse document frequency (TF-IDF) normalization. 这一步既对不同细胞的测序深度进行校正,也对rare peaks赋予更高的值
- Feature Selection: use top n% of features for dimension reduction. Here, use all features.
- Dimension reduction: run singular value decomposition (SVD) on the TF-IDF matrix. SVD与PCA类似都用于线性降维
1 | pbmc_atac <- RunTFIDF(pbmc_atac) |
降维后,可以观察singular values和测序深度的关系,避免降维矩阵捕捉到测序引起的技术误差而非生物学变量相关的信息
1 | DepthCor(pbmc_atac) |
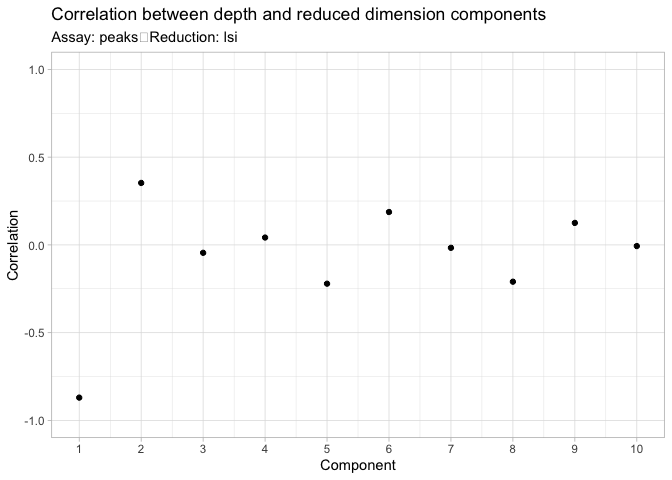
考虑到第一个成分和细胞测序深度有较强的相关性,在后续分析中排除掉该成分进行分析。
换别的Normalization是否可以消除测序深度的variation?
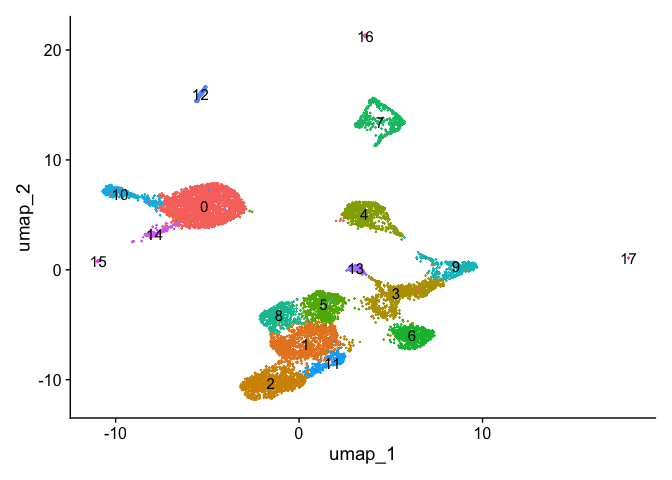
Non-linear dimension reduction and clustering
1 | pbmc_atac <- RunUMAP(pbmc_atac, reduction = 'lsi', dims = 2:30) |
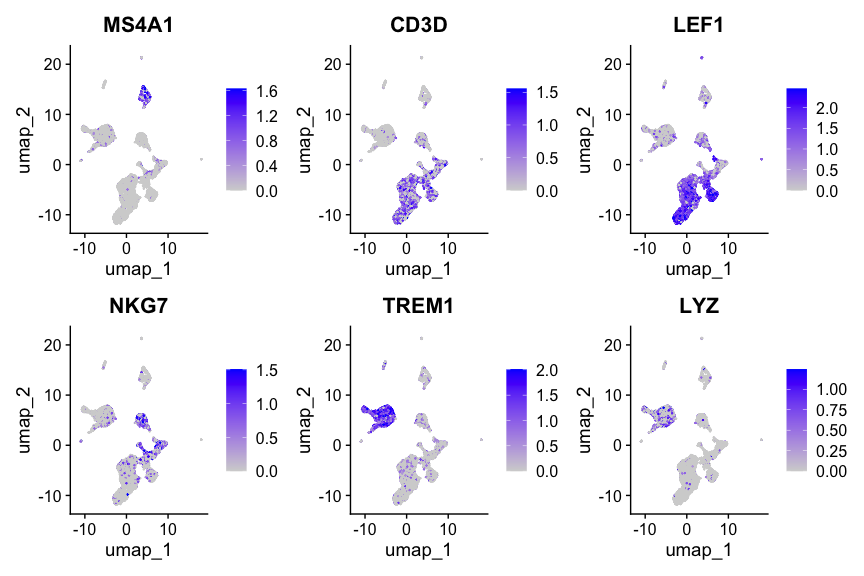
Create gene activity matrix
计算每个基因的染色质开放程度来评估基因活性。这里提取每个基因及其上游2kb的区域(作为promoter),并计算区域内fragments的数目。
注意这里是分析人类的数据,因此promoter区域设置为上游2kb,不同物种需要调整该区域的长度
1 | gene.activities <- GeneActivity(pbmc_atac) |
Find differentially accessible peaks between clusters
接下来,鉴定不同clusters之间的差异peaks。
在做这一步之前,也可以基于ATAC信号进行细胞注释。如果是同时测了单细胞转录组的数据(e.g., 10x Multiome),还可以与注释好的scRNA-seq进行整合,并转移 cell labels.
这里简单展示clusters之间的差异peaks鉴定过程
1 | # peak-level assessment |
For all clusters
1 | de_peak_all <- FindAllMarkers(pbmc_atac, |
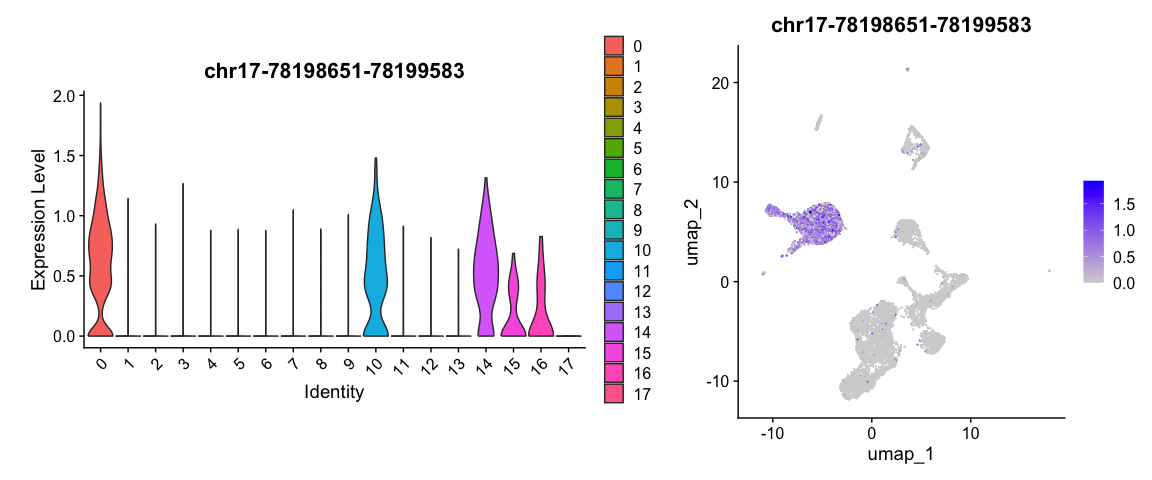
Visualization
Selected peak
1 | plot1 <- VlnPlot( |
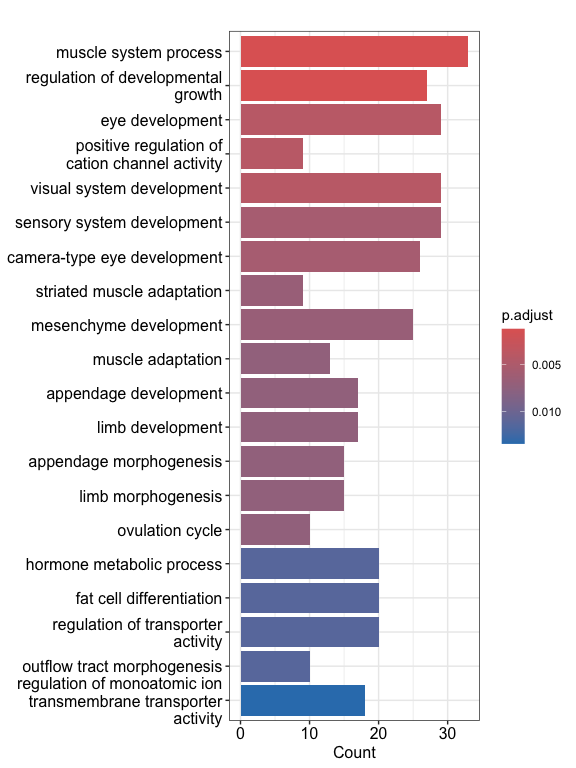
Enrichment analysis
接下来,可以找到与该染色体坐标较近的基因进行分析。这里我们与cluster 0的特异性peaks为例
1 | peaks_cl0 <- subset(de_peak_all, cluster == '0' & avg_log2FC >= 4 & p_val_adj < 0.05)$gene |
进行GO富集分析
1 | library(clusterProfiler) |
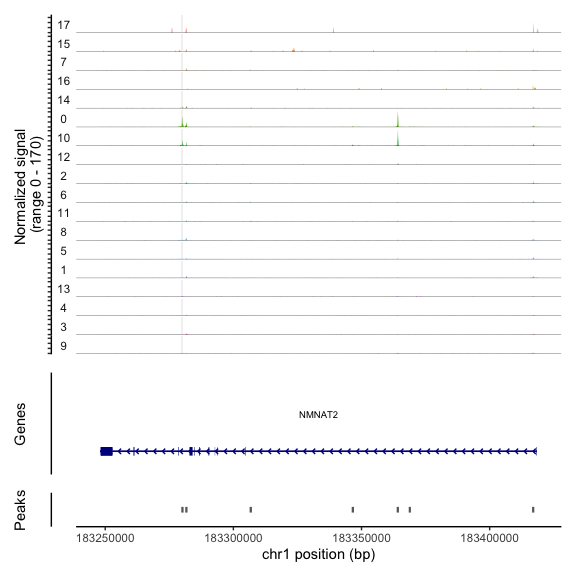
Plot genomic regions
根据clusters之间的相似程度进行cluster排序
1 | pbmc_atac <- SortIdents(pbmc_atac) |
这里,我们可视化NMNAT2基因的结合谱图,该基因具有cluster 0中富集的peak
1 | # find DA peaks overlapping gene of interest |
Summary
使用Signac对单细胞染色质相关数据进行常规分析,我们通常需要:
- 创建对象
- 根据数据特征进行质量控制
- 数据校正
- 降维及聚类
- 细胞注释
- 鉴定细胞特异性染色质开放区域
- 后续的定制化分析,例如富集分析、可视化特定区域等。
以上就是对Signac分析流程的简单介绍。
完。